
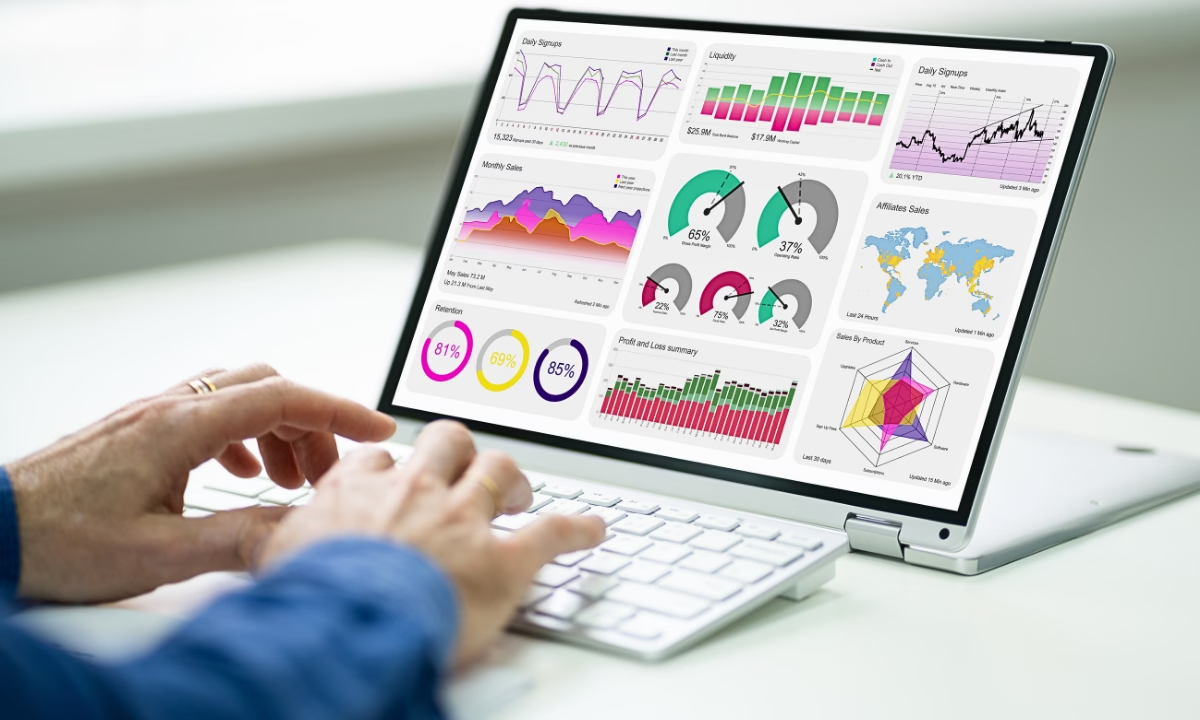
The short answer to the data analyst vs data scientist question is this: a data analyst explains what already happened in a business, while a data scientist builds models that predict or automate what happens next, and the scientist is usually paid more because the job asks for deeper statistics and programming. In the United States, data scientists earned a median of $120,230 a year in May 2025, and the same federal handbook expects the occupation to grow 35% between 2025 and 2035.
That sounds like a golden ticket. It is not quite one. Generative AI is now quietly eating the easiest parts of both jobs, and the people feeling it first are beginners. So in this guide I will lay out the pay, the qualifications, the skills and the AI risk honestly, then give you a beginner roadmap that is built for the market as it actually looks in late 2026, not the market of 2019 bootcamp ads.
Table of Contents
Overview
Difference: Data analysts report and explain; data scientists model and predict. Analysts live in SQL, spreadsheets and dashboards. Scientists add Python, statistics and machine learning.
Pay (US): Data scientist median pay is $120,230 (BLS, May 2025). There is no single BLS “data analyst” category; Glassdoor puts average analyst pay around $86,531.
Outlook: Data scientist jobs are projected to grow 35% from 2025 to 2035, with about 24,800 openings a year (BLS). The World Economic Forum ranks big data specialists as the fastest-growing job to 2030.
AI impact: Young workers aged 22 to 25 in the most AI-exposed occupations saw a 13% relative employment decline (Stanford, 2025). Experienced workers held steady.
Qualifications: A bachelor’s degree is the typical entry point for data scientists; analysts can often break in with a strong portfolio and a certificate.
Beginner route: Spreadsheets and SQL first, then statistics, then Python, then one specialty. Treat AI tools as a skill to master, not a shortcut around learning.
What is the difference between a data analyst and a data scientist?
A data analyst answers “what happened and why,” while a data scientist answers “what will happen and what should we automate.” That one sentence covers most job descriptions you will read.
Think of a mid-sized online store.
The analyst notices that sales in Dhaka dropped 12% last quarter, slices the numbers by product and delivery time, and finds that late deliveries are the real cause.
Then the analyst builds a dashboard so managers can watch delivery delays every week. The data scientist, on the other hand, builds a model that predicts which orders are likely to arrive late before they ship, and maybe a system that reroutes them automatically.
Both jobs touch the same data. The difference is the direction of the work. Analysts look backward and sideways to explain. Scientists look forward to predict and build.
The U.S. Bureau of Labor Statistics describes data scientists as people who collect and clean data, then create, test and update algorithms and models, and who also turn their findings into business recommendations. Interestingly, BLS files “Business Intelligence Analysts” under the same occupation code as data scientists in its O*NET links. In other words, even the government admits the line between the two roles is blurry.
Here is how I would summarise the split:
| Data Analyst | Data Scientist | |
|---|---|---|
| Core question | What happened, and why? | What will happen, and can we automate it? |
| Daily tools | Excel or Google Sheets, SQL, Power BI or Tableau | Python, SQL, Jupyter, scikit-learn, cloud platforms |
| Math level | Descriptive statistics, basic inference | Probability, regression, experimental design, machine learning |
| Typical output | Dashboards, reports, ad-hoc analysis | Predictive models, experiments, data products |
| Entry barrier | Lower; portfolio plus certificate can work | Higher; degree in a quantitative field is typical |
| Who they talk to | Managers, marketing, finance teams | Product teams, engineers, leadership |
| Biggest AI risk | Routine reporting gets automated | Junior modelling and boilerplate code get automated |
One practical warning. Job titles lie. I have seen “data scientist” postings that are really dashboard jobs, and “senior analyst” postings that expect machine learning. Read the responsibilities, not the title.
How much do data analysts and data scientists earn in 2026?
Data scientists in the U.S. earn a median of $120,230 a year, while data analysts typically earn somewhere between the high $70,000s and the low $90,000s, depending on the source and the industry. The gap is real, but it is smaller at the start of a career than the headlines suggest.
Data scientist salary
The BLS figures are the most trustworthy because they come from a large employer survey rather than self-reported numbers. According to the latest Occupational Outlook Handbook update:
- Median pay: $120,230 per year (May 2025)
- Lowest 10% earned less than $67,240
- Highest 10% earned more than $199,130
- Number of jobs in 2025: about 275,600
Industry matters a lot. In the same BLS data, data scientists in publishing, broadcasting and content providers had a median of $142,240, computer systems design paid $132,380, and insurance carriers paid $108,650 (BLS). So the same title can be worth roughly $34,000 more depending on who signs your paycheck.
For context, the previous year’s median was $112,590 (May 2024), so pay rose noticeably in a single year despite all the talk of a tech slowdown.
Data analyst salary
This is where things get messy, and I want to be honest about it. BLS does not track “data analyst” as one occupation. Analyst work is scattered across several categories. Here is what BLS reports for the closest ones in its similar-occupations table, all 2025 medians:
| Occupation (BLS) | 2025 median pay | Typical entry education |
|---|---|---|
| Data scientists | $120,230 | Bachelor’s |
| Mathematicians and statisticians | $105,720 | Master’s |
| Financial analysts | $103,570 | Bachelor’s |
| Operations research analysts | $88,940 | Bachelor’s |
| Market research analysts | $78,760 | Bachelor’s |
Private salary sites fill the gap, but treat them with care. Coursera, citing Glassdoor, reports an average U.S. data analyst salary of $86,531, and the same guide notes that Glassdoor shows analytics managers averaging $131,202 and analytics directors $184,828.
Other sites quote figures from roughly $70,000 to over $110,000, largely because some count base salary and others count total compensation including bonuses. A recruiting firm’s 2026 guide makes the same point: the aggregators simply do not agree on what a data analyst is.
My takeaway: if someone quotes you one precise “average data analyst salary,” ask what it includes.
What about Bangladesh and other non-US markets?
Pay is far lower outside the U.S., and the data is thin, so read these numbers as rough signals only. Payscale lists an average base salary for a data analyst in Bangladesh of about ৳233,000 a year in 2026, while Levels.fyi shows a median total compensation for data scientists in Bangladesh of BDT 981,360, based on only 11 salary submissions.
Eleven data points is not a market. I cannot confirm these figures with certainty, and I would not plan a career around them.
What I can say with more confidence is the strategic point.
For analysts in South Asia, the bigger opportunity is often remote or outsourced work for foreign clients, where a strong portfolio matters more than a local degree certificate. That is an opinion, not a statistic, but it shapes the roadmap later in this article.
Is data science still a good career with AI changing everything?
Yes, data science is still a strong career on paper, but the entry door has narrowed, and that distinction matters more than any growth percentage.
Start with the good news. BLS projects data scientist employment to grow 35% from 2025 to 2035, against an average of just 3% for all occupations, with roughly 24,800 openings every year (BLS). Even more telling, BLS now explains part of that growth with AI itself, saying firms will need data scientists to help them use AI in their business processes and products. AI is a reason for the job, not only a threat to it.
The global picture agrees. The World Economic Forum’s Future of Jobs Report 2025, based on surveys of executives at large employers, named big data specialists the fastest-growing job in percentage terms, ahead of fintech engineers and AI and machine learning specialists.
The same report lists “AI and big data” as the fastest-growing skill, and, as a sobering counterweight, it puts data entry clerks among the fastest-declining jobs. Notice the pattern. Moving data around is dying. Understanding data is growing.
Now the harder news. Job postings tell a more uneven story than ten-year projections. Indeed’s Hiring Lab reported in January 2026 that hiring overall was subdued, but that 45% of data and analytics job postings mentioned AI by December 2025, the highest share of any sector it analysed.
Employers are not hiring “data people” in general anymore. They are hiring data people who can work with AI.
If you want the wider economic and social context, I wrote about it in AI and the future of work, society and humanity.
Will AI replace data analysts and data scientists?
AI is unlikely to replace data analysts and data scientists as whole professions, but it is already replacing many of the tasks that used to train beginners. That is the uncomfortable truth, and you should plan around it.
What the research shows
Three studies are worth knowing.
1. Microsoft’s “Working with AI” study (2025). Microsoft researchers analysed 200,000 anonymised Bing Copilot conversations and scored occupations by how much their work overlaps with what AI can do successfully. Data scientists scored 0.36, one of the higher scores, close to market research analysts at 0.35 (R&D World). But the lead author, Kiran Tomlinson, was careful to add that the research does not indicate AI “can fully perform any single occupation” (Gulf News).
High overlap means your job will change, not that it will vanish. The Register also noted that the paper did not try to measure job losses or wages.
2. Stanford’s “Canaries in the Coal Mine” (August 2025). Erik Brynjolfsson, Bharat Chandar and Ruyu Chen used payroll data from the largest U.S. payroll provider and found that workers aged 22 to 25 in the most AI-exposed occupations saw a 13% relative decline in employment, while experienced workers in the same jobs stayed stable or grew.
For you, the key detail is that declines were concentrated where AI automates human work rather than augments it. Brynjolfsson said the team was struck by seeing such a sharp effect for certain categories and not others.
3. Job-posting data (2026). One industry analysis, citing Indeed Hiring Lab data, reported that entry-level postings fell 7.5% year over year in May 2026 while senior-level postings rose 14.7%. I could not check those figures against Indeed’s own release, so treat them as a reported trend rather than a confirmed number. Still, they point the same way as the Stanford paper.
What this means in plain words
Here is my reading. The tasks AI does well are exactly the tasks companies used to give juniors: writing the first SQL query, cleaning a messy spreadsheet, producing a weekly report, writing boilerplate Python.
The tasks AI still does badly are the ones that need context and judgment: deciding which question matters, noticing that a dataset is biased, explaining a result to a sceptical manager, and taking responsibility when a model is wrong.
So the risk is not “no more data jobs.” The risk is “no more easy first rung on the ladder.” Your strategy as a beginner must be to arrive already able to do some of the judgment work, using AI to move faster on the routine parts.
What qualifications do you need to become a data analyst or data scientist?
For data scientists, a bachelor’s degree in mathematics, statistics, computer science or a related field is the typical entry requirement, and some employers prefer a master’s or PhD. For data analysts, a degree helps, but a solid portfolio plus a recognised certificate can be enough to get interviews.
BLS states that data scientists typically need at least a bachelor’s degree, with common fields including mathematics, statistics, computer science, business and engineering. It also recommends that students take linear algebra, calculus, and probability and statistics, and it notes that some employers want industry experience, for example finance knowledge for an asset management role.
For analysts, the path is more open. The Google Data Analytics Professional Certificate on Coursera, for instance, states that no degree or experience is required and estimates about six months at 10 hours a week. It now includes modules on using AI to clean data, build formulas and create visualizations, which tells you something about where entry-level work is heading.
A few honest notes on credentials:
- A certificate alone rarely gets you hired in a crowded junior market. It gets you vocabulary and a structured start. The portfolio gets you hired.
- A master’s degree is worth it mainly for data science roles in research-heavy companies, or if you are switching from an unrelated field and need structure and a network.
- Domain knowledge is underrated. An accountant who learns SQL and Python can beat a generic graduate for a finance analytics role, because they already understand what the numbers mean.
If you are drawn more to building AI systems than to analysing data, my guide on how to become an AI engineer, with salary and skills for 2026 covers that adjacent path.
Which skills do data analysts and data scientists need most?
The skills that matter most are SQL, statistics, Python, data visualization and clear communication, and in 2026 you should add the ability to use and check AI tools. Here is why each one earns its place.
SQL: the language of business data
Almost every company stores its data in databases, and SQL is how you ask those databases questions. For analysts it is the single most important technical skill. For scientists, it is the skill that gets you your own data without waiting for someone else.
Statistics: the skill AI cannot fake for you
Statistics is what separates a data professional from someone who can run software. You need to understand averages and medians (and when the median is more honest), variance, sampling, confidence intervals, hypothesis testing, correlation versus causation, and regression. AI tools will happily produce a p-value for you. They will not always tell you that your sample was biased or that you tested twenty hypotheses and found one “significant” result by chance. That judgment is your job, and frankly it is your job security.
Python: the shared language of data and AI
Python is the most common bridge between data analysis and AI. In Stack Overflow’s 2025 Developer Survey, Python’s use jumped by 7 percentage points in a single year, which the survey linked to its role in AI, data science and back-end work, and it is now used by about 58% of respondents. For data work, the key libraries are pandas (tables), NumPy (numbers), Matplotlib or Seaborn (charts) and scikit-learn (machine learning).
To make this concrete, here is the kind of short Python you will write in your first weeks. It answers “which region had the most late deliveries?”:
import pandas as pd

orders = pd.read_csv("orders.csv")
orders["late"] = orders["delivered_days"] > orders["promised_days"]

late_by_region = (
    orders.groupby("region")["late"]
    .mean()
    .sort_values(ascending=False)
)
print(late_by_region.head())
Six lines, and you have moved from raw data to a business answer. That is the whole job in miniature.
Visualization and storytelling
A finding nobody understands changes nothing. Tools like Power BI, Tableau or Looker Studio matter, but the deeper skill is choosing the one chart that makes a manager say “oh, I see.”
BLS lists communication as a core quality for data scientists, specifically the ability to explain results to technical and non-technical audiences.
Machine learning (mainly for data scientists)
Learn the basics well before chasing the fashionable: linear and logistic regression, decision trees and random forests, clustering, train-test splits, overfitting, and how to evaluate a model honestly. Most business problems are solved with these, not with giant neural networks.
AI literacy: the new baseline
By AI literacy I mean three things: using AI assistants to write and debug code faster, knowing their failure modes (made-up functions, wrong joins, confident nonsense), and verifying everything they produce. The professional who uses AI and checks it will beat both the one who refuses AI and the one who trusts it blindly.
Big data and cloud basics
Larger companies store data in cloud warehouses and process it with distributed tools. You do not need these on day one, but you will meet them quickly. My piece on how to become a big data specialist goes deeper into that track, which, as noted earlier, the World Economic Forum ranks as the fastest-growing job category.
What is the best beginner roadmap to become a data analyst or data scientist?
The best beginner roadmap starts with spreadsheets and SQL, adds statistics, then Python, and finishes with a portfolio built around real questions. Expect around 12 months of steady part-time study to become job-ready as an analyst, and longer for data science. Below is the plan I would follow if I were starting today, assuming roughly 10 to 12 hours a week.
Months 1 to 2: Spreadsheets and data thinking
- Learn Excel or Google Sheets properly: formulas, lookups, pivot tables, conditional formatting, basic charts.
- Practise asking good questions of a dataset before touching it. What decision will this answer change?
- Milestone: Analyse one public dataset (a city’s transport data, a cricket dataset, your own household spending) and write a one-page summary.
Months 3 to 4: SQL
- Learn SELECT, WHERE, GROUP BY, JOINs, subqueries and window functions.
- Practise on free platforms with real-looking business tables.
- Use an AI assistant to explain errors, but write each query yourself first.
- Milestone: Answer ten business questions from a sample sales database and publish the queries on GitHub.
Months 5 to 6: Statistics
- Descriptive statistics, distributions, sampling, confidence intervals, hypothesis tests, A/B testing, correlation versus causation, simple regression.
- Milestone: Design and analyse a simple A/B test, and write up what you can and cannot conclude.
Months 7 to 8: Python for data
- Python basics, then pandas, NumPy and Matplotlib.
- Recreate your earlier spreadsheet and SQL projects in Python. Seeing the same problem three ways teaches more than three new problems.
- Milestone: A Jupyter notebook that cleans a messy dataset end to end, with comments explaining each choice.
Months 9 to 10: Visualization and one dashboard
- Learn Power BI or Tableau.
- Milestone: A live dashboard on a topic you care about, plus a short written story of what it shows.
Months 11 to 12: Portfolio and specialisation
- Pick a domain: finance, health, retail, sports, public policy, garments and supply chains, whatever you know.
- Build three portfolio projects in that domain. Each should have a clear question, messy real data, your method, your result and its limits.
- Analyst track: Start applying now.
- Scientist track: Spend the next 6 to 12 months on machine learning with scikit-learn, more probability, linear algebra and model evaluation, and build one project that predicts something useful.
One rule across all twelve months: never paste AI-generated code you cannot explain line by line. In an interview, someone will ask.
Should you become a data analyst or a data scientist first?
For most beginners, becoming a data analyst first is the smarter route, because it is faster to enter, teaches the business side, and leads naturally into data science later. Choose data science directly only if you already have a strong math or programming background.
Choose the analyst path if:
- You come from business, economics, social science, or a non-technical degree.
- You want to be earning within a year.
- You enjoy explaining things to people more than building systems.
Choose the scientist path if:
- You have, or are studying for, a degree in statistics, math, computer science or engineering.
- You enjoy probability and programming for their own sake.
- You can afford a longer runway before your first job.
Many of the best data scientists I have read about started as analysts. The analyst years taught them which questions actually mattered to a business, which is the part no model can supply.
What mistakes should beginners avoid?
The biggest beginner mistake is learning tools without learning to ask questions. Several others follow close behind:
- Course hoarding. Ten certificates and zero projects tell an employer you can watch videos.
- Skipping statistics because Python feels more exciting. Statistics is what makes your Python output trustworthy.
- Using Kaggle-perfect datasets only. Real data is ugly. Show you can clean it.
- Trusting AI output blindly. Every AI-written query should be tested against a number you can check by hand.
- Hiding the limits of your analysis. Hiring managers trust the candidate who says “this result has a sampling problem” far more than one who oversells.
- Ignoring communication. If you cannot explain your project in two minutes to a non-technical friend, you are not ready for the interview.
Personal take: the career ladder is moving, not disappearing
I want to end the main section with the one idea I think matters most. When people ask whether AI will take data jobs, they usually imagine a robot walking into an office and sitting at a desk. That is not what the evidence shows. What the Stanford payroll data shows is subtler and, in some ways, more worrying: the bottom rung of the ladder is getting thinner, while the upper rungs are fine.
That changes how you should study. A decade ago, you could get hired to do the routine work and learn judgment on the job. Today, routine work increasingly goes to AI, so you need to bring some judgment with you. Five lessons follow from that:
- Learn the “why” behind every method. Know why you chose the median over the mean. AI can calculate both; only you can defend the choice.
- Build projects that start with a question, not a dataset. “Do late deliveries reduce repeat orders?” beats “I analysed a dataset.”
- Make verification a visible skill. In your portfolio, show where you caught an error, AI-made or your own.
- Pick a domain early. Domain knowledge is the context AI lacks, and it makes you harder to replace.
- Use AI to go faster, never to skip understanding. The Stanford findings suggest jobs where AI augments people hold up better than jobs where it simply automates them. Make yourself the augmented kind.
Frequently asked questions
Is a data analyst a good job for beginners?
Yes. Data analyst roles remain one of the most accessible entry points into tech, since many employers accept a portfolio and certificate instead of a specialised degree. The entry-level market is tighter than a few years ago, so a strong portfolio matters more than ever.
Do data analysts need to know Python?
Not always, but it helps. Many analyst jobs run on SQL, spreadsheets and BI tools. Python becomes important as you move toward automation, larger datasets or data science.
Can I become a data scientist without a degree?
It is possible but harder. BLS notes that data scientists typically need at least a bachelor’s degree. Self-taught routes usually go through an analyst job first.
Which pays more, data analyst or data scientist?
Data scientist, generally. The BLS median for data scientists is $120,230, while most analyst-type occupations sit lower, for example $88,940 for operations research analysts and $78,760 for market research analysts (BLS).
How long does it take to become a data analyst?
With about 10 hours of study a week, six to twelve months is realistic to become job-ready, depending on your background. Google’s certificate alone estimates about six months at 10 hours a week, but you will need extra time for portfolio projects.
Is data science dying because of AI?
No. BLS projects 35% growth to 2035 and explicitly links some of that demand to companies adopting AI (BLS). What is shrinking is routine, entry-level task work, not the profession.
Conclusion
The data analyst vs data scientist choice is less about which title sounds better and more about where you are starting from. Analysts get in faster and learn the business. Scientists earn more and build the predictive systems, but face a higher bar.
Both careers have strong long-term numbers behind them, from the BLS 35% growth projection to the World Economic Forum’s ranking of big data roles. Both also face a real squeeze at the entry level, because AI now handles much of the routine work beginners once used to learn.
My recommendation: if you are a student, a career switcher, or someone in Bangladesh or anywhere else eyeing remote data work, start with the analyst path, master SQL and statistics before chasing fancy models, learn Python as your bridge to AI, and build a portfolio that proves you can think, not just click. The jobs are there. The easy doors are not. Walk in through the harder one, prepared.
Sources
- U.S. Bureau of Labor Statistics, Occupational Outlook Handbook: Data Scientists
- U.S. Bureau of Labor Statistics, Operations Research Analysts
- World Economic Forum, Future of Jobs Report 2025: fastest growing and declining jobs
- Stanford SIEPR, Canaries in the Coal Mine? (Brynjolfsson, Chandar, Chen, 2025)
- R&D World on Microsoft’s “Working with AI” study
- The Register on Microsoft’s AI applicability research
- Indeed Hiring Lab, January 2026 US Labor Market Update
- Stack Overflow Developer Survey 2025
- Coursera, Data analyst salary guide (citing Glassdoor)
- Google Data Analytics Professional Certificate, Coursera
- Payscale, Data Analyst salary in Bangladesh
- Levels.fyi, Data Scientist salary in Bangladesh